This page is the opinion of Optimus Futures.
There’s more to structuring your trade than just charting and analyzing price action. To be more well-rounded in your approach, it helps to have a watchlist, alerts, leaderboards, news, indexed ideas, and even social forums to bounce your ideas off other traders.
TradingView provides all of the above and more to help you day trade from a wider perspective and a broader context of ideas.
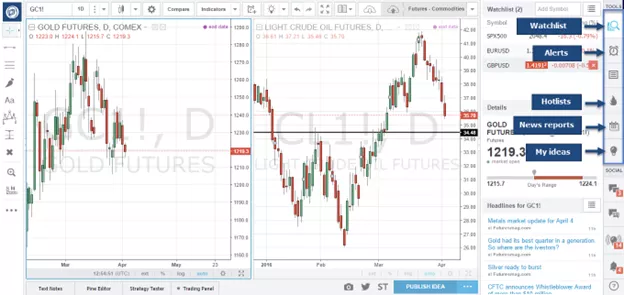
Let’s focus on the right-hand side menu in your TradingView platform. Here you can find your watchlists, price alerts, hotlists, news calendars, and ideas.
We will now take a closer look at each one and explain how to use them to structure your day trading and also allow you to create a more professional trading routine.

Creating your overall dashboard profile is like preparing the overall context for your analysis and trading.
For example, let’s suppose you trade micro futures for the big three US stock indices. You might want to call your layout “Micro Indicies,” combining the following instruments:
So, when you load the profile “Micro Indices,” you’ll pull up all the charts you used for MYM, MES, and MNQ.
Remember: each profile is a collection of individual charts. Using the profile function, you can then see different views depending on how you set your chart templates.

The leaderboard is geared more toward stock trading as it shows individual stocks based on price, volume, and other characteristics.
However, if you are a futures trader, it can also pay off to keep track of different sectors in the stock market since most of the markets are highly correlated.
Remember that every quarter, the stock index futures tend to be swayed heavily by corporate earnings season; and that earnings are often grouped in sectors.
The leaderboard is an opportunity for you to follow earnings more closely, as it may significantly affect the futures contracts you are trading (particularly if you trade any of the four major US indices).
When using the leaderboard function, note that you can choose from a variety of different options to change the layout of your leaderboard (2).

TradingView’s news function is one of the better features of any trading platform. The tool allows you to access all information directly from your charts, which makes it convenient for traders who like to keep an eye on breaking news and headlines while they analyze charts.
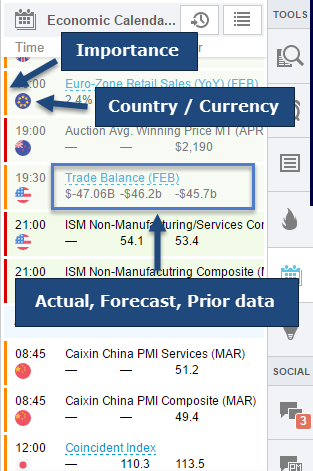
By clicking on the calendar (1), you enable the window that gives you a complete overview of all upcoming news events.
You can customize the view by clicking on the menu icon (2) and then filter the news TradingView shows you by importance or based on country/region.


Want to backward-engineer a news trade?
TradingView’s news function allows you to plot prior news events directly onto your charts. This allows you to see the impact of previous news so that you might develop strategies that might allow you to trade a similar news-driven scenario.
To plot news onto a chart, select the settings icon at the top (1), go to “Events & Alerts” (2) and activate the option “Show economic Events on Chart”.
Afterward, you find circled flags at the bottom of your chart and by hovering over them, you get information about the report itself and you can directly see how the news release impacted price movements on your charts during the last release.

The Ideas tool is is a fully integrated trading journal.
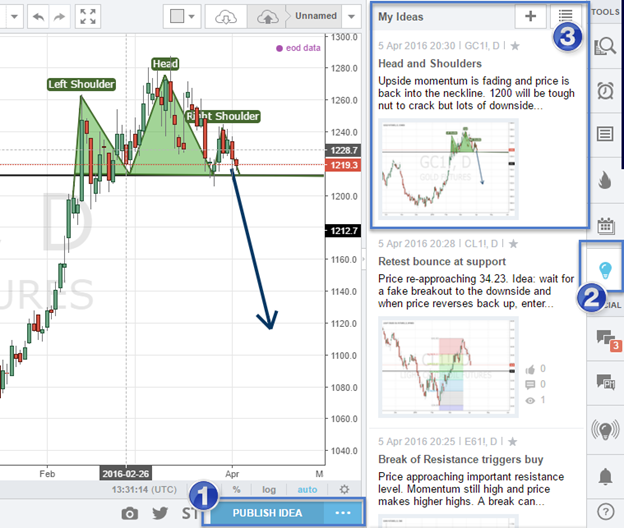
Basically, you can capture a screenshot of your current chart layout by clicking on “Publish Ideas” (1) at the bottom of your TradingView platform which will open a new window where you can write notes (or ideas in that case) and save them in your TradingView Ideas-stream (3).

In our next TradingView guide we will show you how to use the ideas function to establish a powerful review process, but for now, it’s enough to know that you can capture your current chart layout and record your ideas.
You can also plot your past Ideas directly onto your charts, or those of other TradingView users.
To accomplish either, select the Ideas icon in your top menu (the lightbulb icon) and choose from any of the three options.
You can then hover over the red and yellow dots on your chart to get more information about the ideas that have been published.

Subscribe to the Futures Trading Newsletter
Copyright © 2024 Optimus Futures – All Rights Reserved
This material should be viewed as a solicitation for entering into a derivatives transaction. Trading futures and options involves substantial risk of loss and is not suitable for all investors. Past performance is not necessarily indicative of future results. The risk of loss in trading commodity interests can be substantial. You should therefore carefully consider whether such trading is suitable for you in light of your financial condition.
The placement of contingent orders by you or broker, or trading advisor, such as a “stop-loss” or “stop-limit” order, will not necessarily limit your losses to the intended amounts, since market conditions may make it impossible to execute such orders. The high degree of leverage that is often obtainable in commodity interest trading can work against you as well as for you. The use of leverage can lead to large losses as well as gains. Optimus Futures, LLC is not affiliated with nor does it endorse any trading system, methodologies, newsletter or other similar service. We urge you to conduct your own due diligence.
If you are going to engage in any trading activity with Futures on Virtual Currencies including Bitcoin, please view NFA & CFTC advisories providing more information on these potentially significant risks.